
A recent article in MarketingProfs.com offered “Seven Disastrous Data Don’ts” with a quick snapshot of common mistakes marketers make when dealing with Big Data. The author made good points, and I am not refuting them at all. Rather, in pursuit of further edification on the topic, I thought I’d pick up where the author left off on the two disastrous don’ts we’re most familiar with here at ClickMail, to expand on them a bit and offer a solution.
The two disastrous don’ts I want to focus on are numbers 4 and 6, which you’ll find described—and expanded upon—below:
#4 Inability to Effectively Analyze Your Data
I quote from the article:
Often, marketers see a spreadsheet with numbers and letters, and aren’t sure what they mean and what to do with them.
I agree wholeheartedly with this (although I have a different solution). Helping clients understand their email marketing and testing results is part of our professional service offerings at ClickMail. This inability to effectively analyze data, however, does not result from stupidity or ignorance, but rather from a lack of tools to help marketers understand what is going on. Marketers are smart folks! Honestly, who can look at a spreadsheet and makes sense of it at a glance?
Yes, as the article states, “categorization and standardization” of the data might help, but in our experience, marketers need more than that. Categorizing and standardizing will still result in flat, passive reporting that marketers must mess with to understand.
Instead, marketers need tools to help them gain immediate insights into the data in front of them, especially as email marketing grows in sophistication and plays a larger role in omni-channel marketing. And dare I even mention how overworked everyone is? All the marketers I know are already stretched to the max. They don’t have hours to configure data results and interpret them. They need a way to see at a glance what’s happening and react to it, and I’m not sure categorizing and standardizing alone will achieve that.
What can help is seeking out a tool that does away with the spreadsheets and gives immediate insight into the data—at a glance.
#6 Wrong Tools
Speaking of tools…. Again, I quote from the article:
Digital marketers are only as good as the tools they use. There are so many tools out there that you can harness and combine to creatively find ways to gain better insights into your data and business processes.
Having someone who keeps up to date on all of these tools is crucial to the continued success of your data management.
I also agree with disastrous don’t #6 about wrong tools. However, I don’t think the solution is to “harness and combine” and get creative. Nor do I think dedicating one person to keeping on top of a range of tools to be efficient. I think the solution is to find the one tool you can rely on to give you the insight you need in a meaningful and timely manner.
For this reason, I’m a big fan of email analytics that are visual. Have you ever looked at a spreadsheet and immediately known the answer to your question? Not me. A spreadsheet usually requires me to first figure out what I’m looking at, then start piecing together the various data points in my mind to see the numbers that matter. It’s a time-consuming process and an error-prone one.
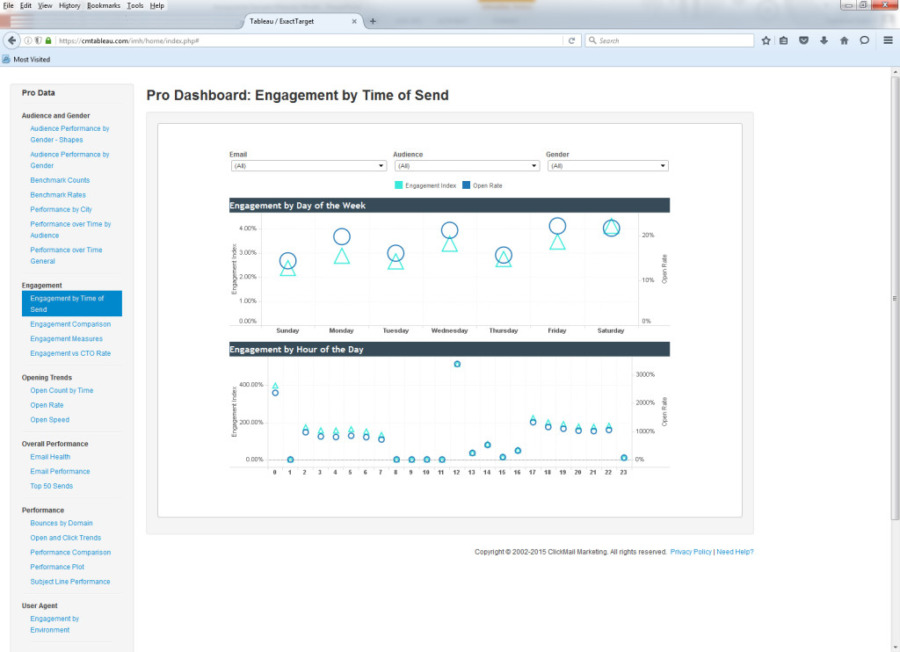
With visual analytics, however, data can be understood in an instant. For example, in this screenshot from eMVision, I can see the level of engagement for each email based on the send day and time. Note I said engagement, not open rate. This chart shows me the open rate too. At a glance, I can make correlations between my send day, my send time, my open rates and my engagement rates. Imagine trying to reflect all of this information in one easily understood spreadsheet.
You shouldn’t have to cobble together an approach. You shouldn’t have to have one staff person dedicated to keeping up with the tools. You should be able to invest in and rely on one robust tool that delivers most—if not all—of what you need in a reporting and email analytics solution.
Our industry is seeing a rapid increase in the numbers of third-party vendors developing solutions that complement ESPs, so marketers can do more without having to rely on the ESP to make new capabilities and features available. (See the many third-party apps featured on the Salesforce Hub Exchange.) eMVision, for example, is an analytics tool we built because our clients asked for a more powerful, faster, easier-to-use tool. (And it’s available to you too!) Other vendors are also building solutions. So don’t settle for a cobbled together solution. Seek out an email analytics solution that saves you from disaster don’ts 4 and 6, and possibly any other disaster don’ts as well.
If you’d like to learn more about data don’ts and ways to avoid them, call on ClickMail. We’re happy to help!